什么是 pprof
pprof 是 Go 官方提供的性能分析工具,可以分析程序的运行情况,并且提供可视化的功能。prof 是 profile(画像)的缩写,使用 pprof 可以分析以下几种指标数据:
allocs:程序启动之后内存分配的情况block:导致阻塞操作的一些堆栈跟踪信息cmdline:当前程序启动的命令行goroutine:所有当前goroutine的堆栈跟踪信息heap:程序在当前堆上内存分配的情况mutex:锁资源的竞争的堆栈信息profile:CPU profile文件。可以在debug/pprof?seconds=x秒GET参数中指定持续时间。获取pprof文件后,使用go tool pprof x.prof命令分析pprof文件。threadcreate:系统线程的使用情况trace:当前系统的代码执行的链路情况
使用 pprof 工具主要分析以下几种指标:
CPU Profiling:CPU分析,按照一定的频率采集所监听的应用程序CPU(含寄存器)的使用情况,可确定应用程序在主动消耗CPU周期时花费时间的位置Memory Profiling:内存分析,在应用程序进行堆分配时记录堆栈跟踪,用于监视当前和历史内存使用情况,以及检查内存泄漏Block Profiling:阻塞分析,记录goroutine阻塞等待同步(包括定时器通道)的位置Mutex Profiling:互斥锁分析,报告互斥锁的竞争情况。
当程序存在内存或者 CPU 飙升的情况时,我们可以通过 pprof 工具来查询问题出现的根源。
怎么使用 pprof
pprof 包含两个相关的库:
runtime/pprof
主要应用于工具型应用。包含脚本、定时任务等。
如:对于只跑一次的程序,例如每天只跑一次的离线预处理程序,调用 pprof 包提供的函数,手动开启性能数据采集net/http/pprof
主要应用于服务型应用。包含 HTTP 服务,GRPC 服务等。
如:对于在线服务,对于一个 HTTP Server,访问 pprof 提供的 HTTP 接口,获得性能数据。当然,实际上这里底层也是调用的runtime/pprof提供的函数,封装成接口对外提供网络访问。
工具型应用
工具型应用主要使用 runtime/pprof 包实现性能分析。
func main() {
    // --- cpu 分析示例 start---
    // 创建cpu分析文件
    fc, err := os.Create("./cpu.prof")
    if err != nil {
        fmt.Println("create cpu.prof err:", err.Error())
        return
    }
    defer fc.Close()

    // 开始分析cpu
    err = pprof.StartCPUProfile(fc)
    if err == nil {
        defer pprof.StopCPUProfile()
    }
    // --- cpu 分析示例 end---

    var count int
    for i := 0; i < 10000; i++ {
        count++
    }

    // --- 内存 分析示例 start---
    fm, err := os.Create("./memory.prof")
    if err != nil {
        fmt.Println("create memory.prof err:", err.Error())
        return
    }
    defer fm.Close()

    // 开始分析内存
    err = pprof.WriteHeapProfile(fm)
    if err != nil {
        fmt.Println("write heap prof err:", err.Error())
        return
    }
    // --- 内存 分析示例 end---

    for i := 0; i < 10000; i++ {
        count++
    }
    fmt.Println("do finish......count:", count)
}
执行 go run main.go 后,在代码目录下,可以看到生成了 cpu.prof 和 memory.prof 文件。
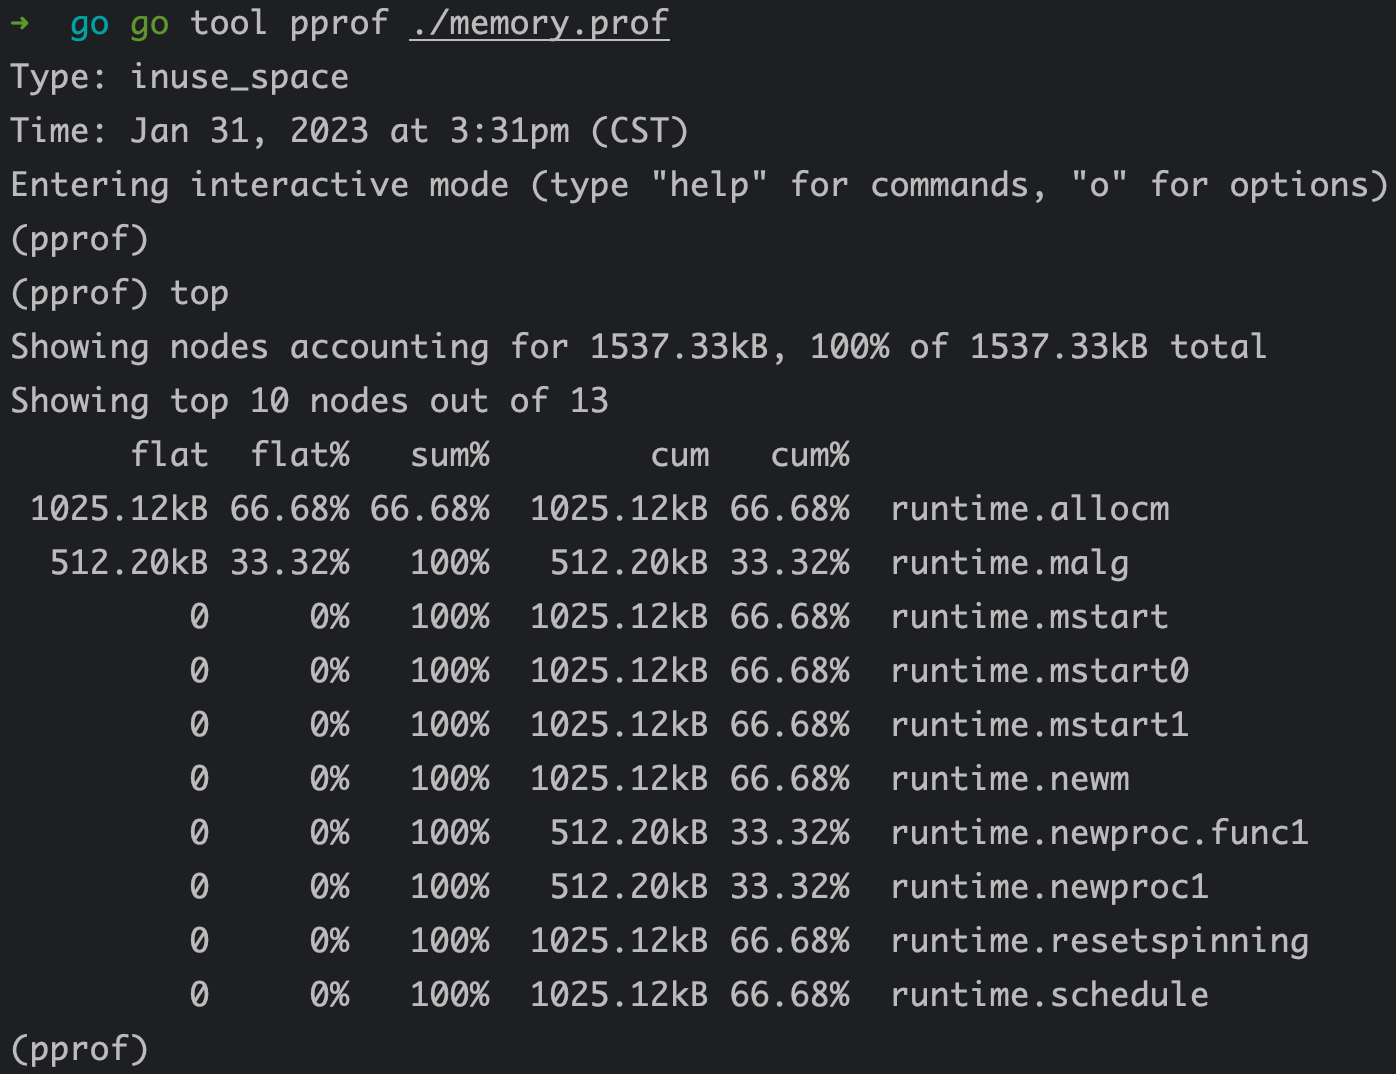
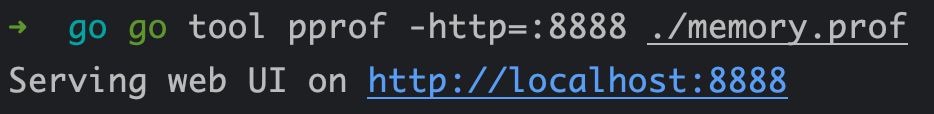
通过执行 go tool pprof ./memory.prof 或者 go tool pprof -http=:8888 ./memory.prof 进入命令行模式或者 web 页面进行性能分析。
执行 go tool pprof ./memory.prof 进入命令行:
执行 go tool -http=:8888 pprof ./memory.prof 可进入 web 页面,更方便查看:
页面展示效果:
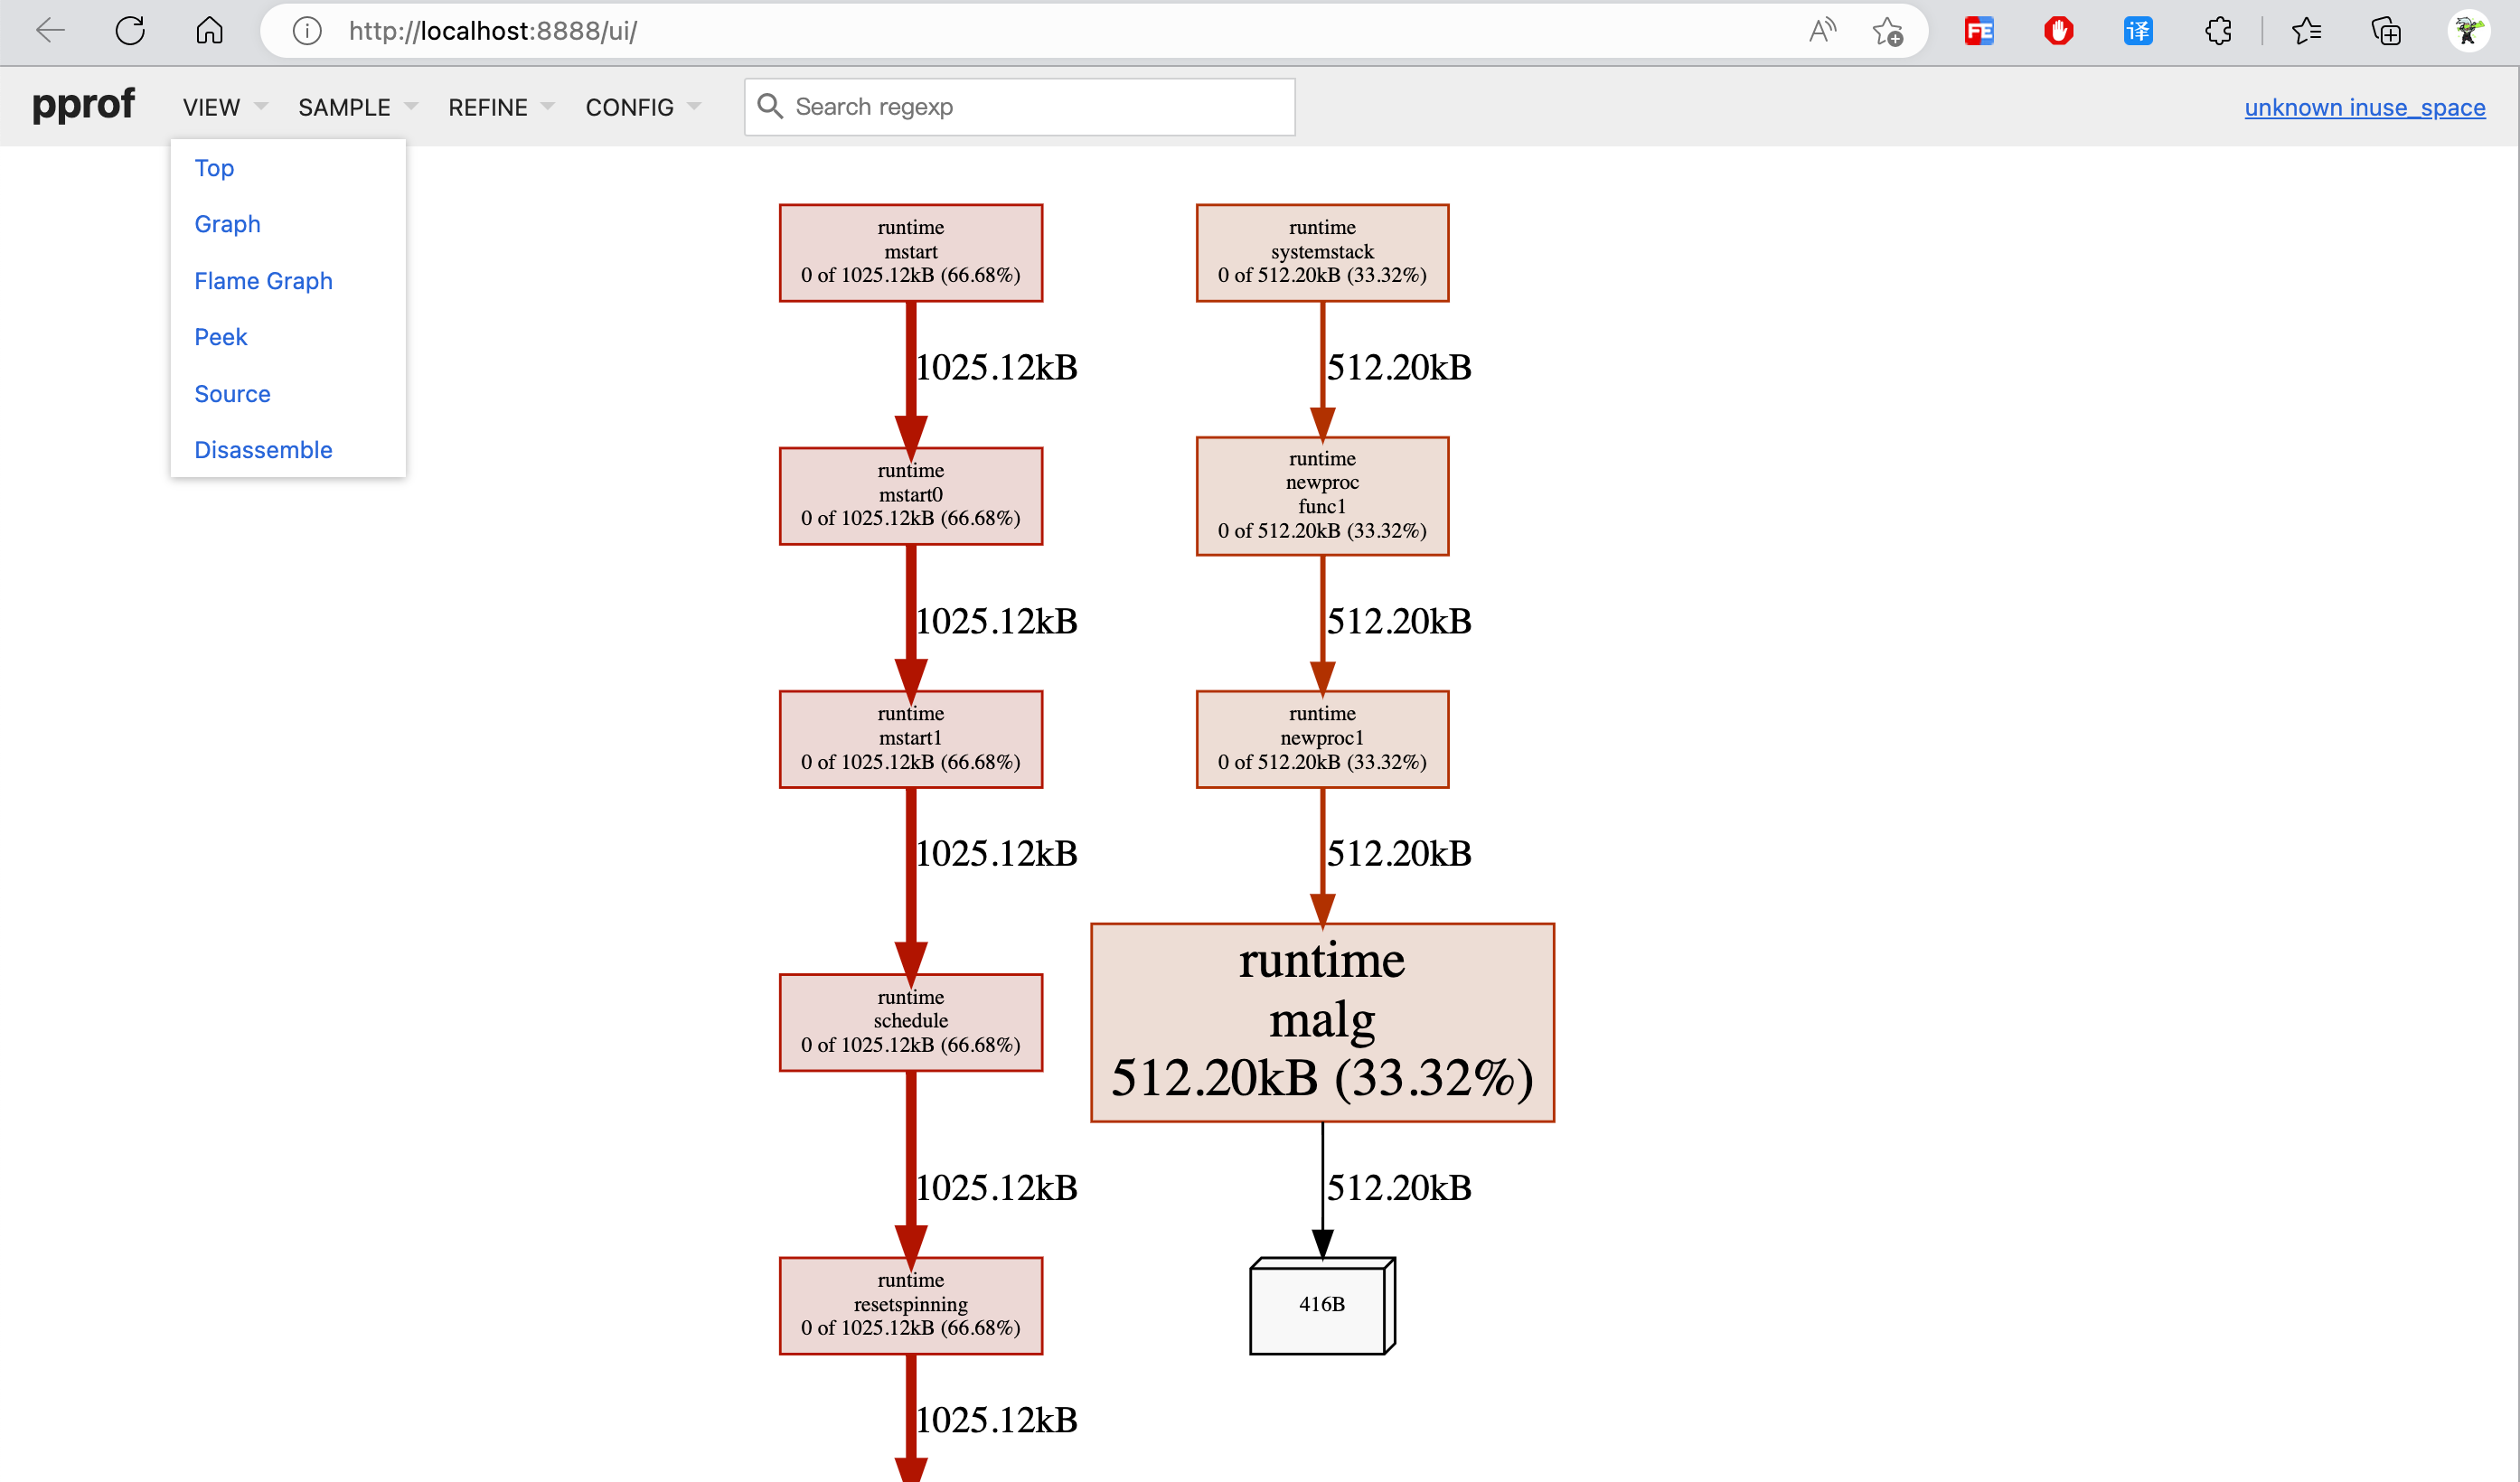
SAMPLE 各个标签的含义解释:
服务型应用
对于服务类型的应用,主要在服务内部匿名引入 net/http/pprof 包,然后通过 HTTP 访问 pprof 页面。
匿名引入方式为:import _ "net/http/pprof"
package main
import (
"fmt"
"net/http"
_ "net/http/pprof"
)
func main() {
http.HandleFunc("/", hello)
err := http.ListenAndServe(":8080", nil)
if err != nil {
fmt.Println("ListenAndServe Err:", err.Error())
return
}
}
func hello(resp http.ResponseWriter, req *http.Request) {
fmt.Fprintln(resp, "Hello World, Are You OK?")
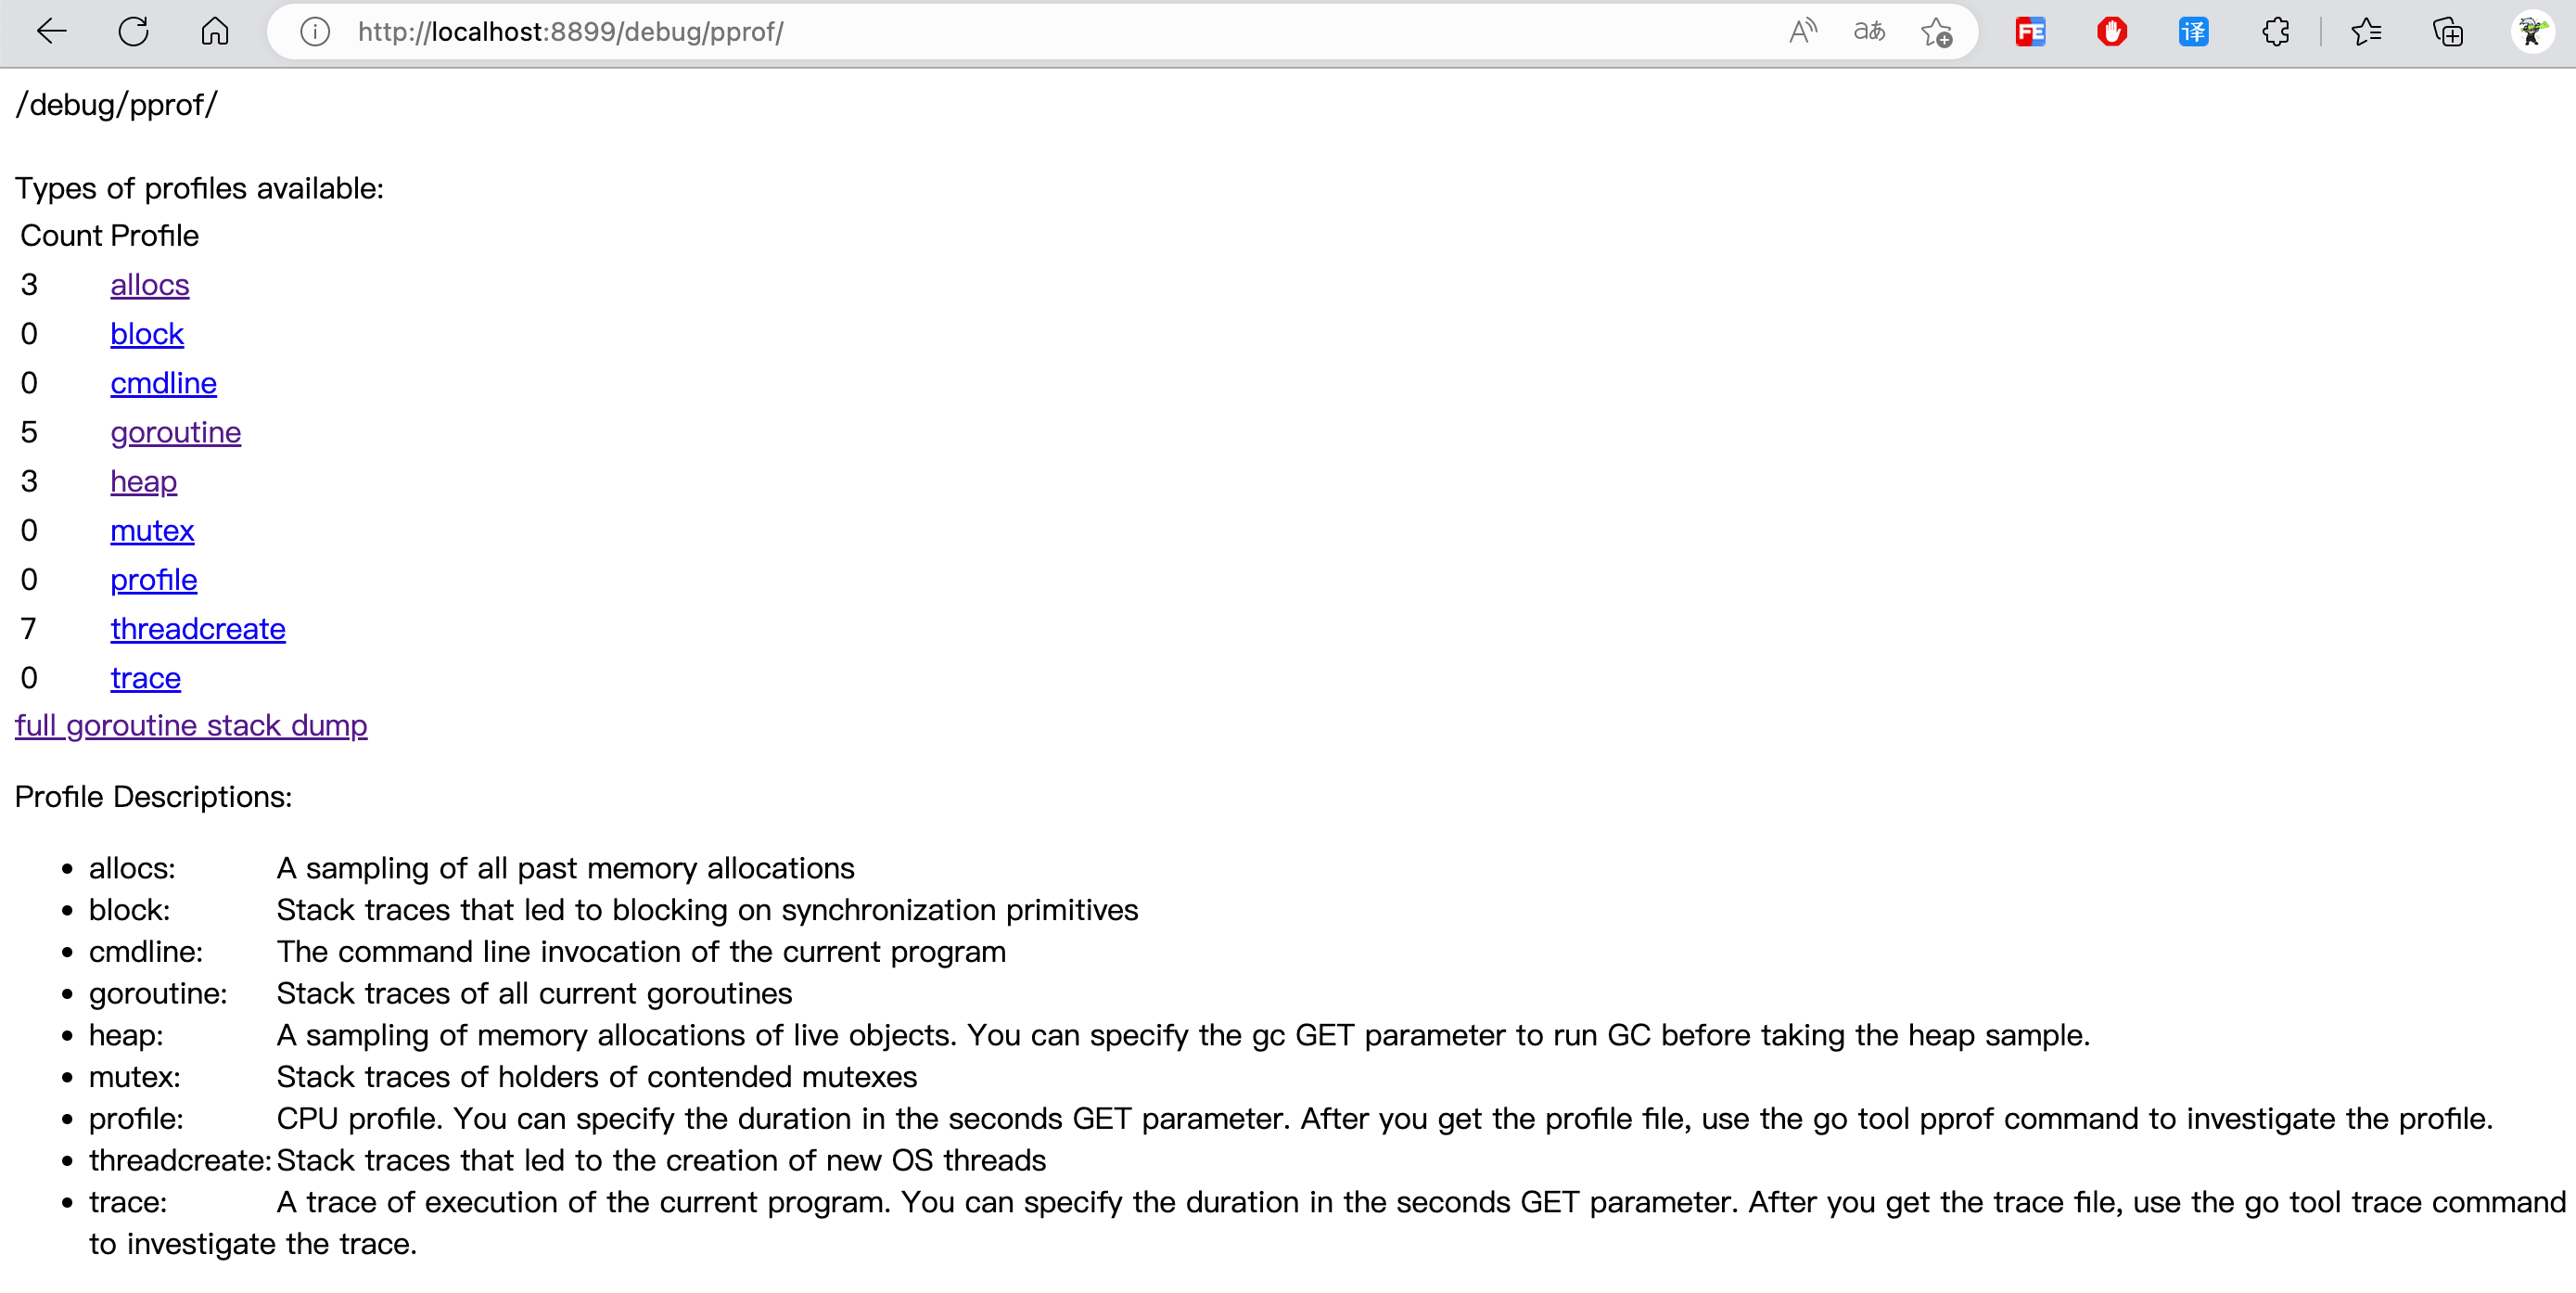
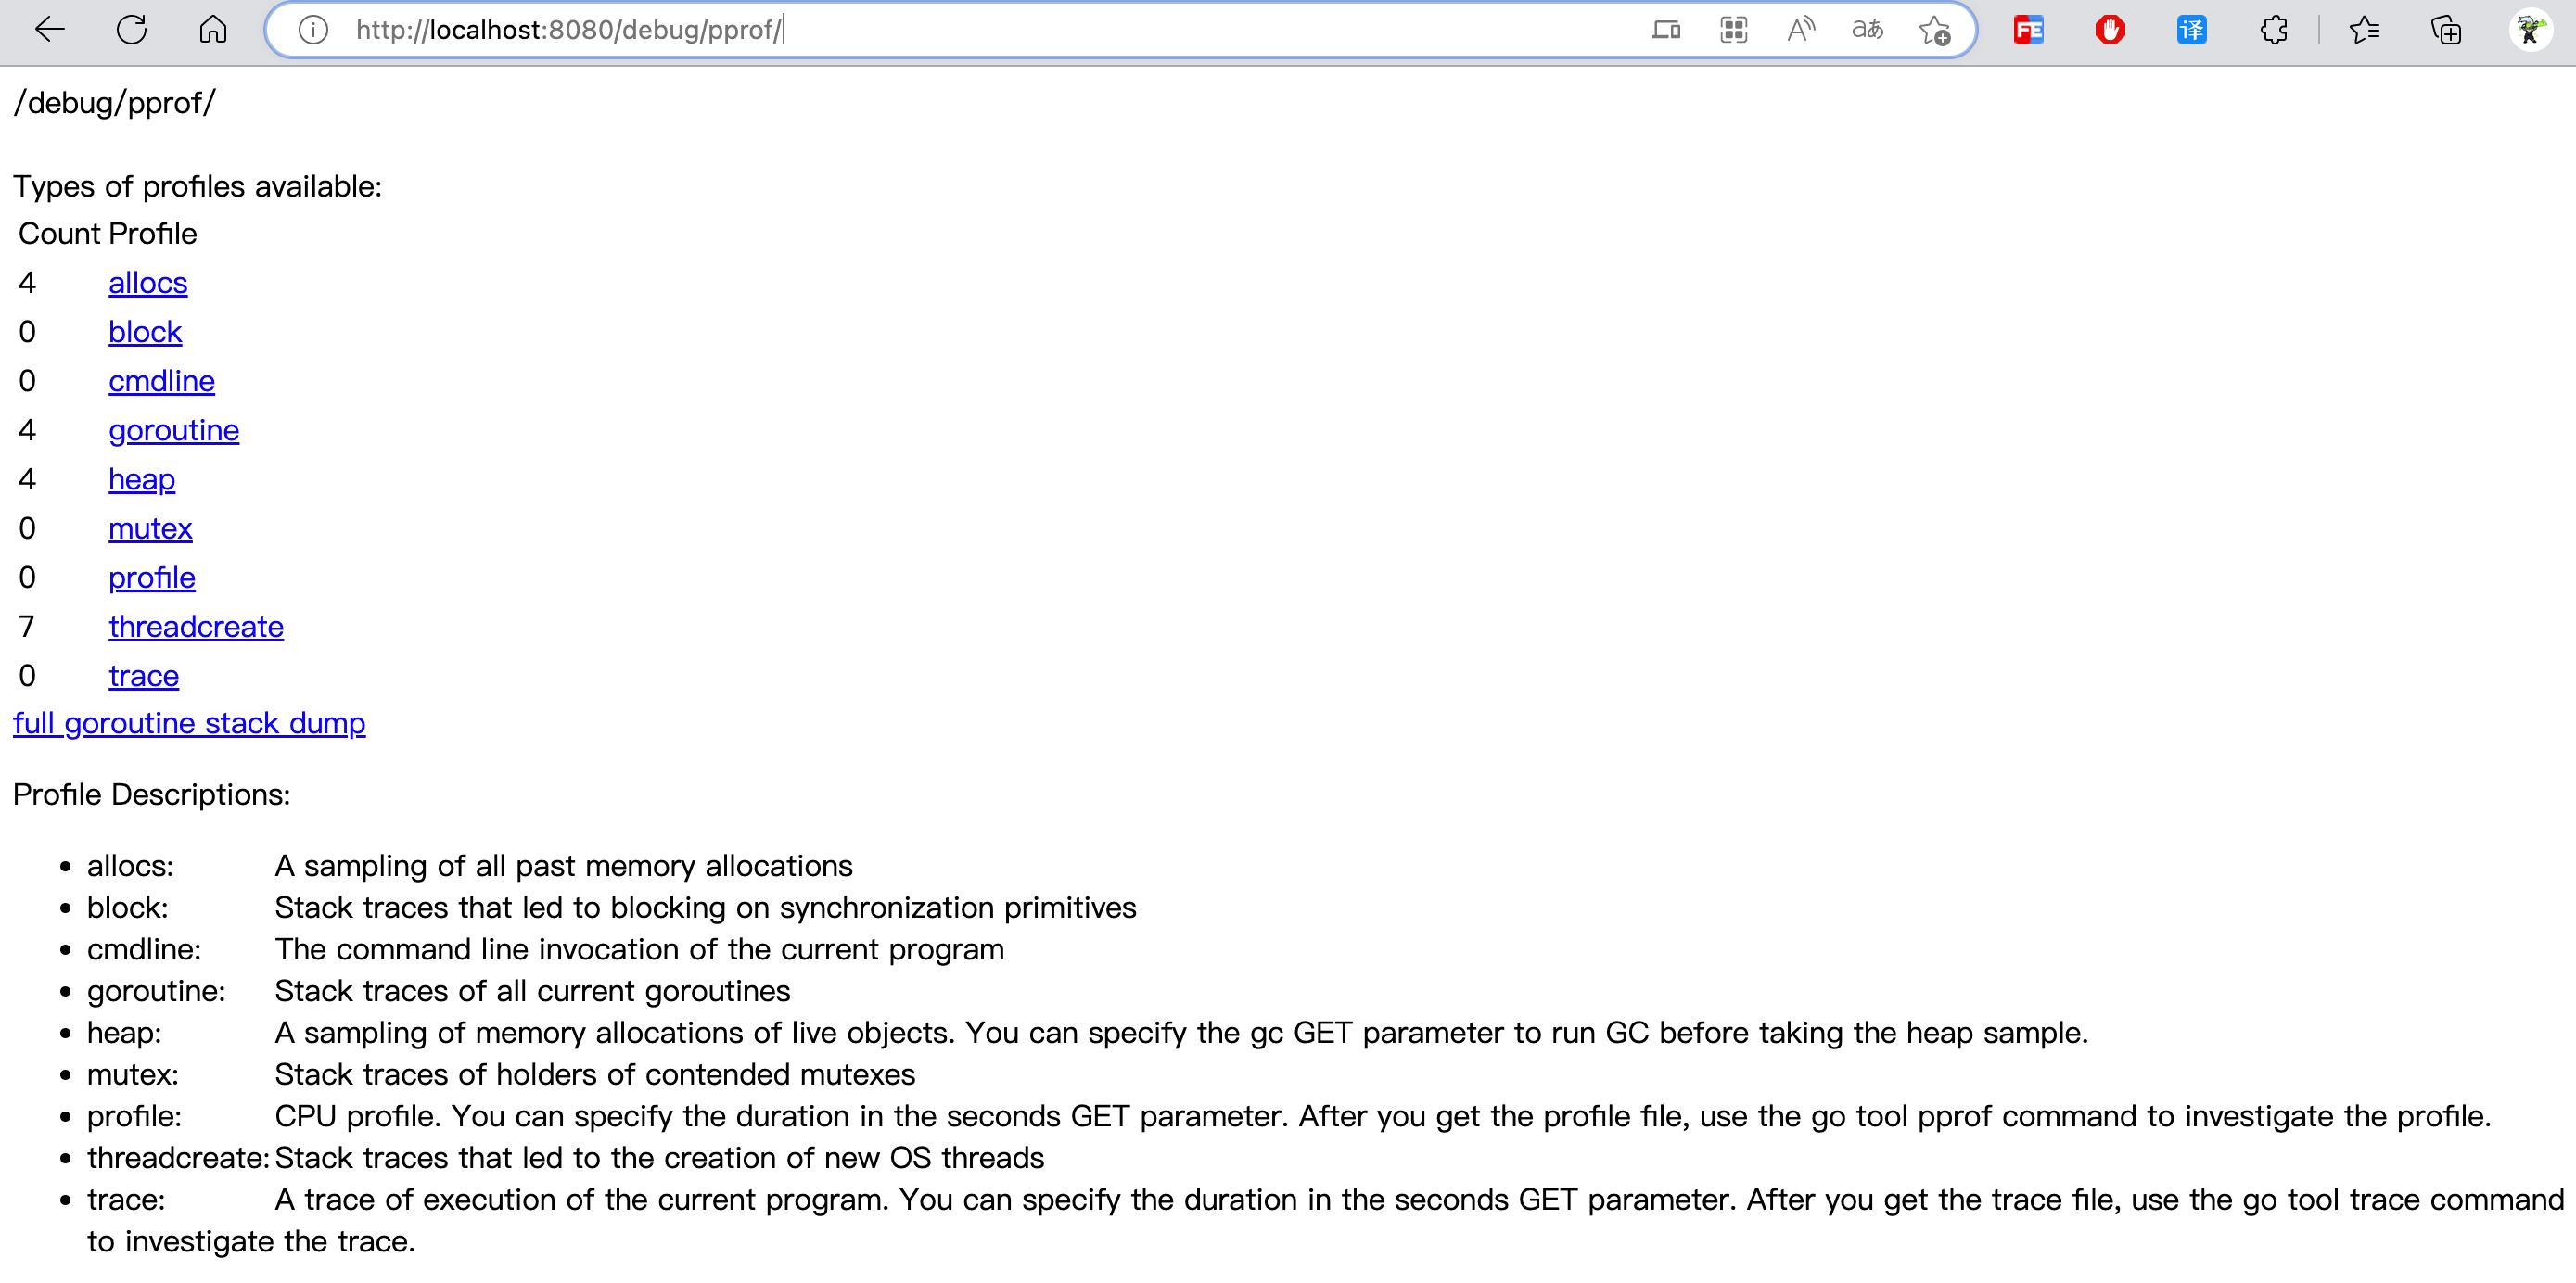
}执行 http://localhost:8080/debug/pprof/ 可以看到画像信息:
但是需要注意,如果 HTTP 服务不是通过
http.ListenAndServe(":8080", nil) 启动的,而是指定第二个参数启动的话,需要自己注册 pprof 路由。
在 net/http/pprof/pprof.go 的官方源码注释中也提到此种情况:
If you are not using DefaultServeMux, you will have to register handlers with the mux you are using.
如果您不使用 DefaultServeMux,则必须向所使用的多路复用器注册 pprof 处理程序
http. ListenAndServe 函数可以传递 handler,如果 handler 不为 nil,则说明研发自定义了 ServeMux,否则用的是默认 DefaultServeMux
net/http/pprof 包中,有 init 函数
func init() {
   http.HandleFunc("/debug/pprof/", Index)
   http.HandleFunc("/debug/pprof/cmdline", Cmdline)
   http.HandleFunc("/debug/pprof/profile", Profile)
   http.HandleFunc("/debug/pprof/symbol", Symbol)
   http.HandleFunc("/debug/pprof/trace", Trace)
}
所以如果使用默认 ServeMux,则不需要注册,但是如果使用自定义的 ServeMux,则需要增加注册后,才能获取到 pprof。
// 自己注册这几个函数
r.HandleFunc("/debug/pprof/", pprof.Index)
r.HandleFunc("/debug/pprof/cmdline", pprof.Cmdline)
r.HandleFunc("/debug/pprof/profile", pprof.Profile)
r.HandleFunc("/debug/pprof/symbol", pprof.Symbol)
r.HandleFunc("/debug/pprof/trace", pprof.Trace)
另外一种启动 pprof 的方式在生产环境中更加常用:通过协程另起一个 HTTP 服务,单独用作 pprof 分析:
func RegisterProf() {
    go func() {
        if err := http.ListenAndServe(":6060", nil); err != nil {
            panic("pprof server start error: " + err.Error())
        }
    }()
}
pprof 数据分析
GO 官方提供了 go tool pprof 工具来帮助我们分析 pprof 生成的数据文件。
使用 go tool pprof 分析数据,主要有两种模式:
- 命令行交互模式
go tool pprof [file_pprof|url_pprof] - web 页面模式
go tool pprof -http=:6666 [file_pprof|url_pprof]
其中,file_pprof表示生成的prof分析文件,如cpu.prof;url_pprof表示远端服务开启的pprof访问,如http://localhost:8080/debug/pprof/profile
进入命令行交互模式后,可以使用 help 查看所有子命令,使用 help <cmd|option> 查看子命令使用方法。如 help、help top 等
CPU Profiling
浏览器访问 /debug/pprof/profile 会自动进行 CPU profiling,默认持续 30 s,并生成一个文件供下载,可以通过带参数 ?seconds=60 进行 60 秒的数据采集。
为了模拟请求,使用 ab 进行压测:ab -k -c 1 -t 180 -n 100000000 http://localhost:8080/hello
执行 go tool pprof http://localhost:8080/debug/pprof/profile 后,默认需要等 30 s 才会显示交互
top 指令排序展示
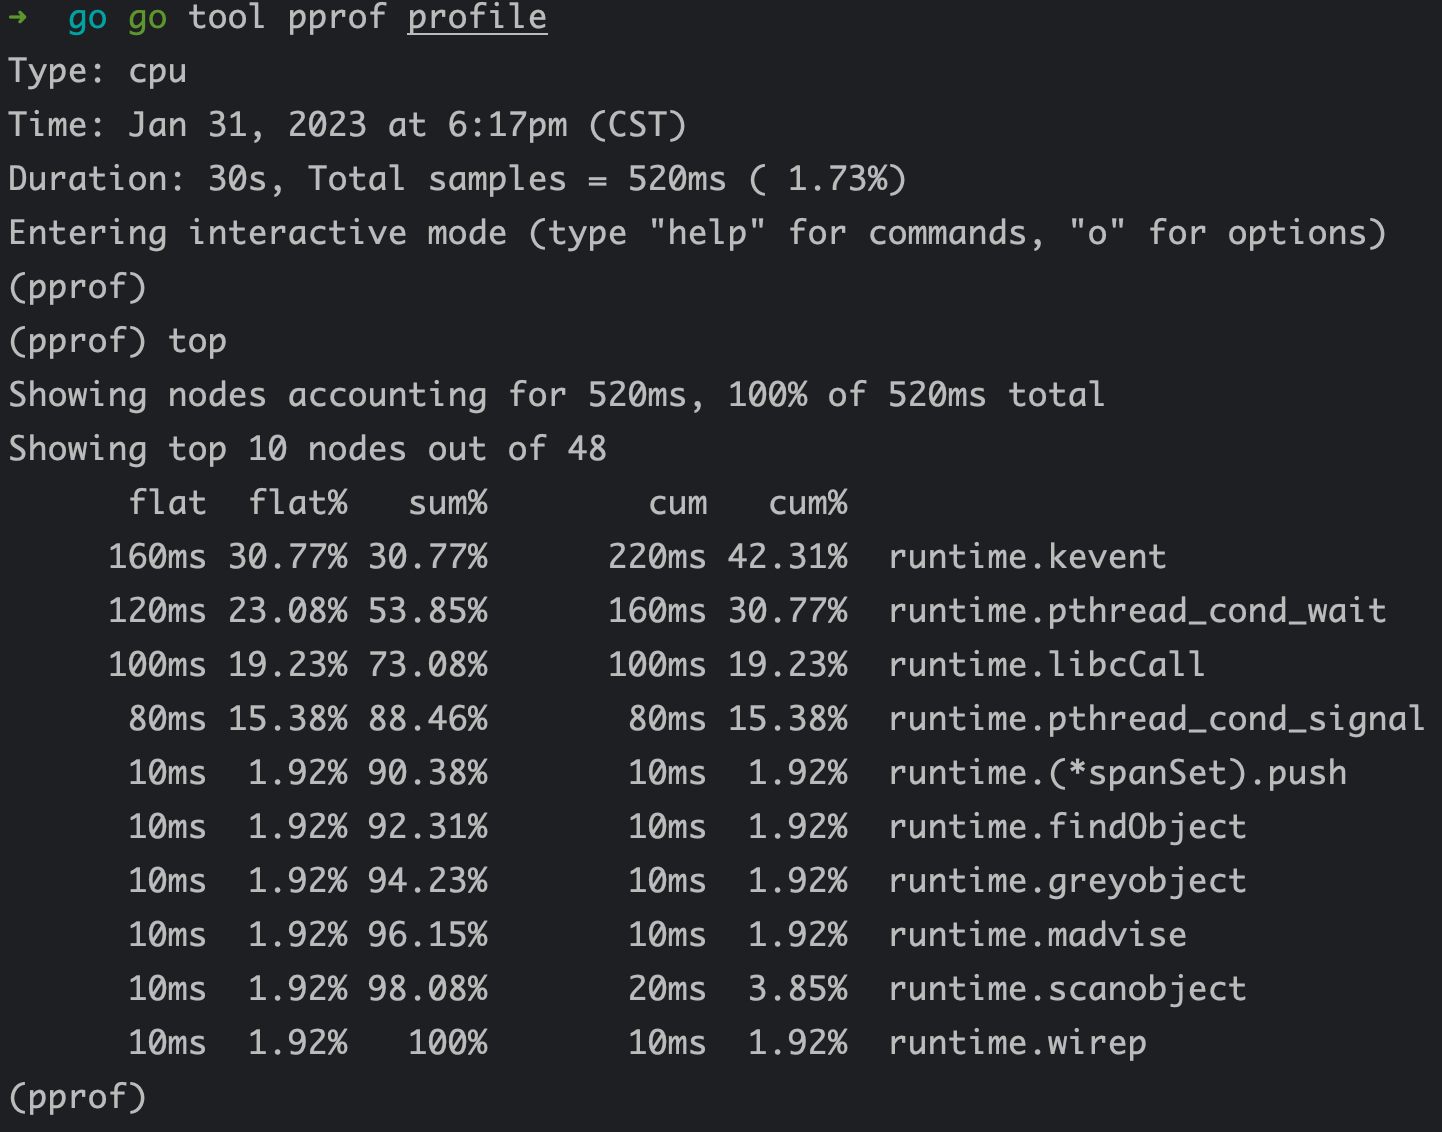
每一行表示一个函数的信息,列信息字段解释:
flat:函数在 CPU 上运行的时间flat%:函数在 CPU 上运行时间的百分比sum%:是从第一行到当前行所有函数累加使用 CPU 的比例,如第二行 sum=53.85=30.77+23.08cum:这个函数以及子函数运行所占用的时间,应该大于等于 flatcum%:这个函数以及子函数运行所占用的比例,应该大于等于 flat%最后一列:函数的名字
web 指令生成图示
在交互模式下输入 web,会自动生成一个 svg 文件,并跳转到浏览器打开。
改功能需要安装 graphviz 后才能使用,安装方法 https://shidawuhen.github.io/2020/02/08/go-callvis/。
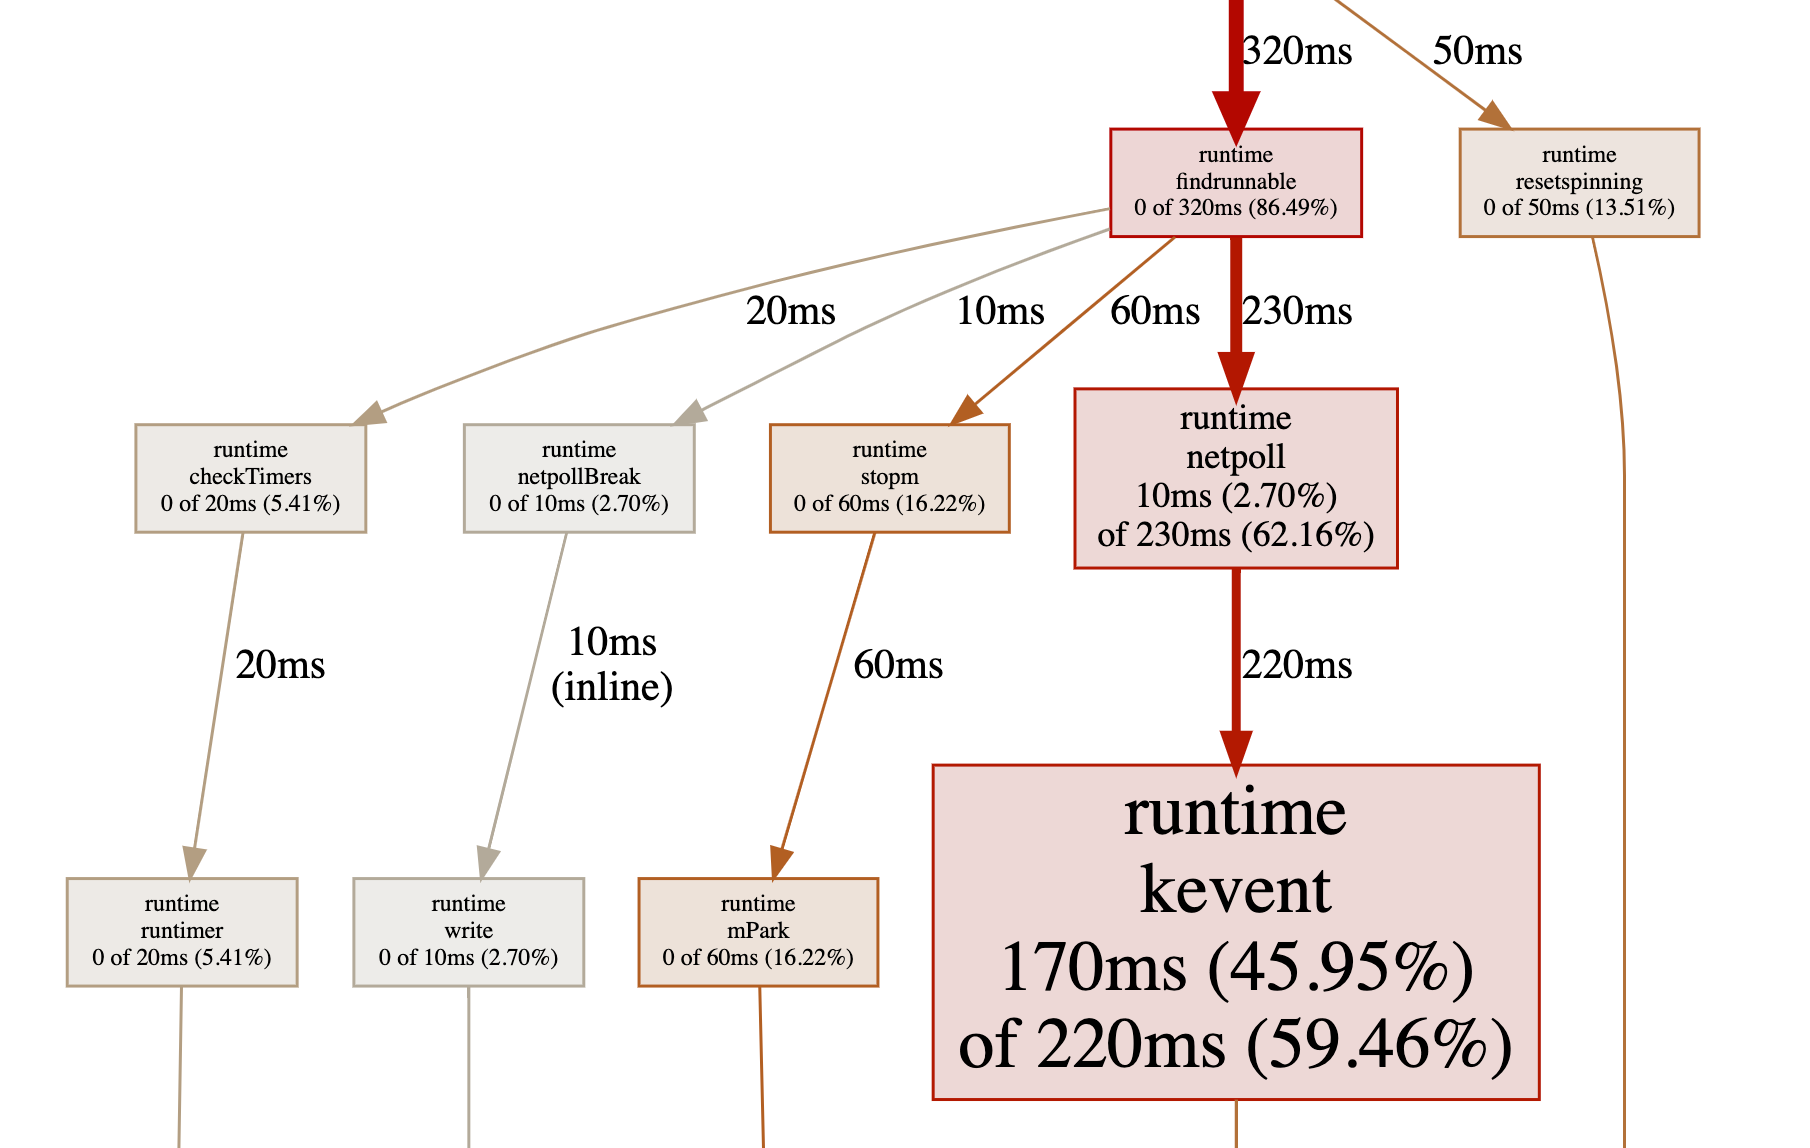
图中每个方框对应应用程序运行的一个函数,方框越大代表函数执行的时间越久(函数执行时间会包含它调用的子函数的执行时间,但并不是正比的关系);方框之间的箭头代表着调用关系,箭头上的数字代表被调用函数的执行时间。
具体细节可以参考:https://github.com/google/pprof/tree/master/doc#interpreting-the-callgraph
以 runtime netpoll 为例:
- 箭头上的
230 ms表示该函数总共的执行时间,包含自身和下游所有子节点; - 方框中的
10 ms表示自身的执行时间; - 方框中的
2.70%表示自身执行时间在该函数总共执行时间的占比在总时间中的占比:2.70 = (10/230)*62.16 - 方框中的
62.16%表示总时间占比,即整个程序耗时占比。
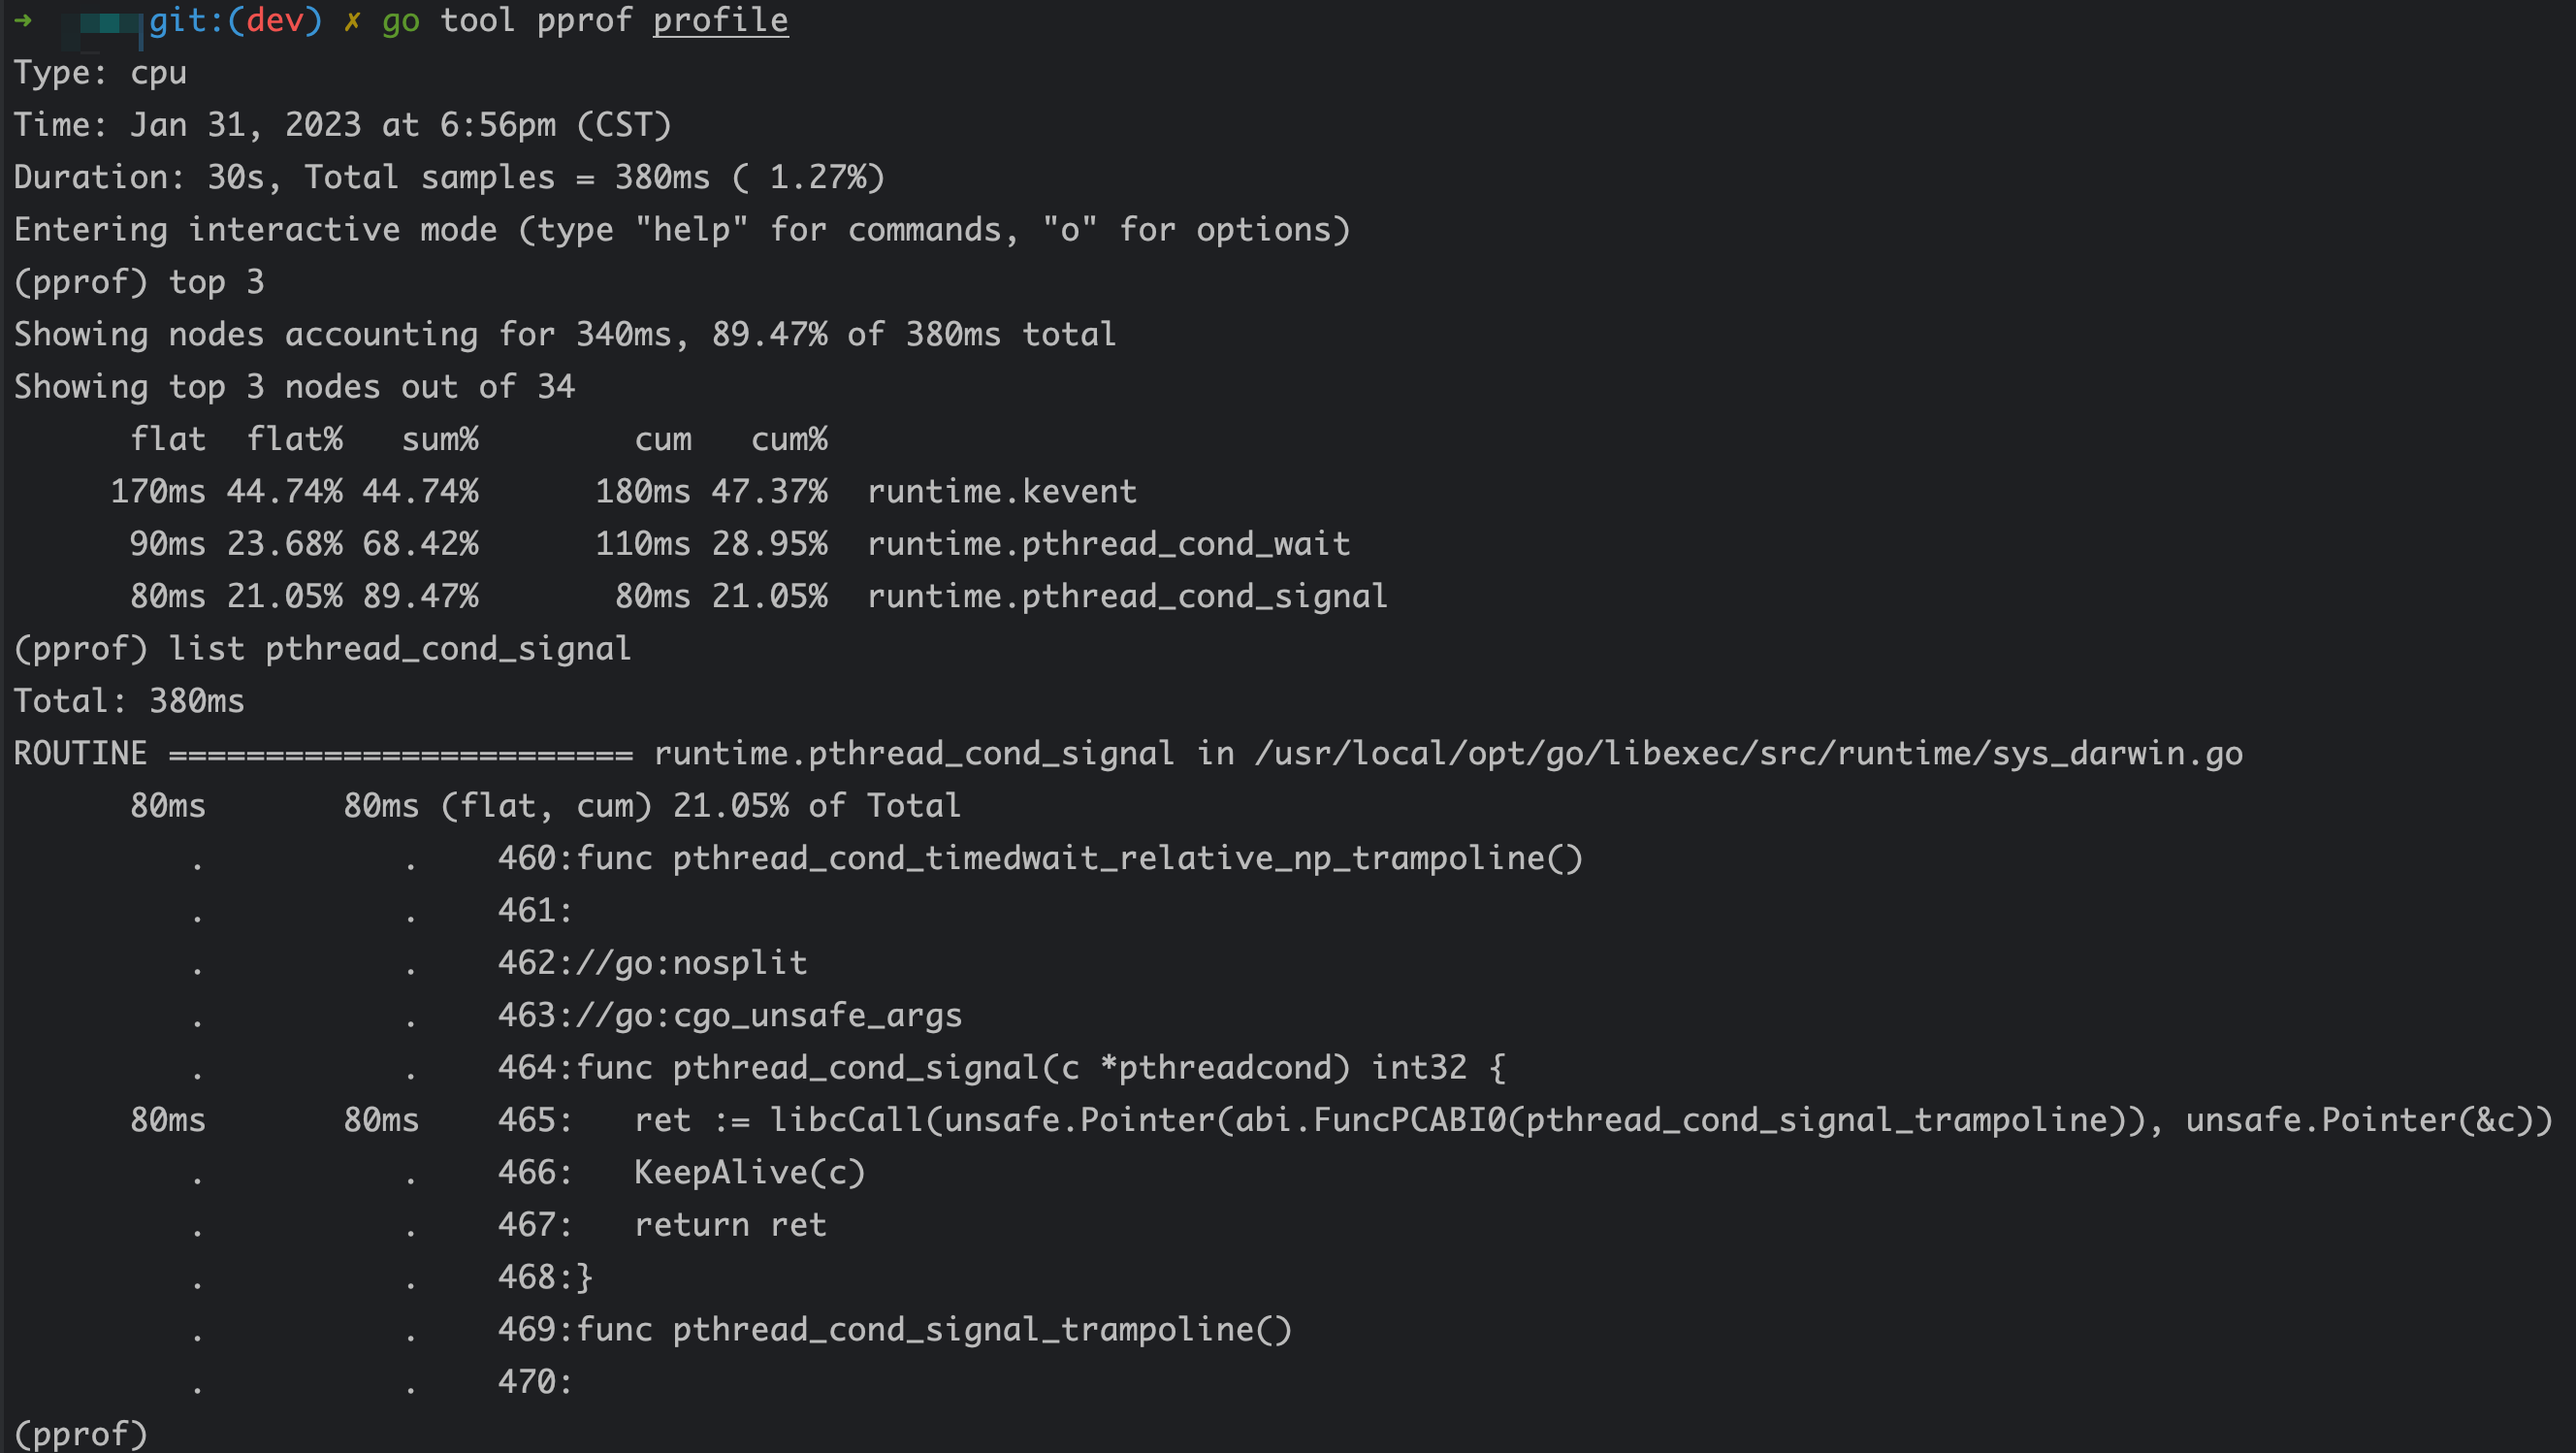
list 指令分析函数
确定出哪个函数耗时之后,可以用 pprof 分析函数中的哪一行导致的耗时,使用子命令:list 函数名。
堆内存分析示例
内存分配既可以发生在堆上也可以在栈上。堆上分配的内存需要垃圾回收或者手动回收(对于没有垃圾回收的语言,例如 C++),栈上的内存则通常在函数退出后自动释放。
Go 语言通过逃逸分析会将尽可能多的对象分配到栈上,以使程序可以运行地更快。
这里说明一下,有两种内存分析策略:
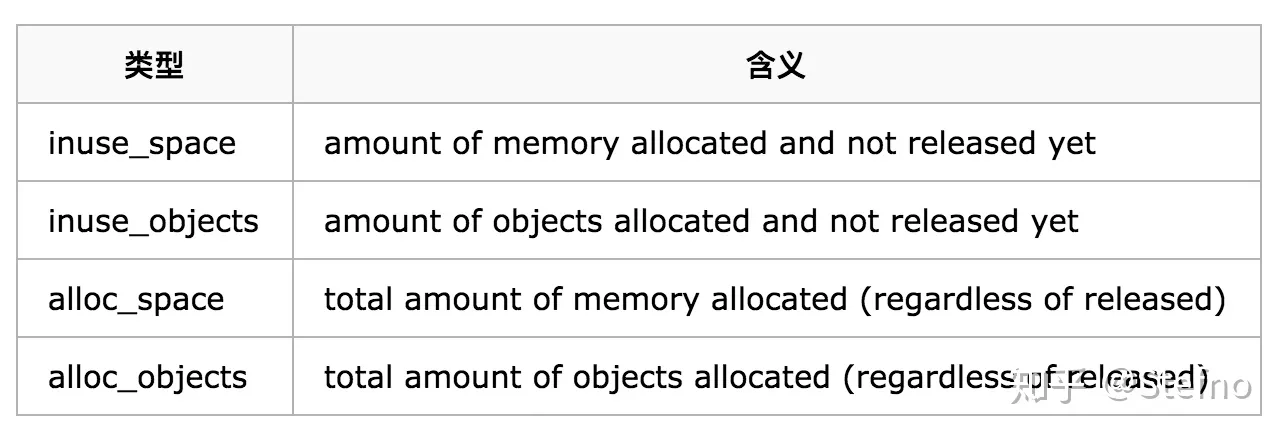
- 一种是当前的(这一次采集)内存或对象的分配,称为
inuse; - 另一种是从程序运行到现在所有的内存分配,不管是否已经被
gc过了,称为alloc。
As mentioned above, there are two main memory analysis strategies with pprof. One is around looking at the current allocations (bytes or object count), called inuse. The other is looking at all the allocated bytes or object count throughout the run-time of the program, called alloc. This means regardless if it was gc-ed, a summation of everything sampled.
加上 -sample_index 参数后,可以切换内存分析的类型:
go tool pprof -sample_index=alloc_space http://localhost:8080/debug/pprof/heap
或者
go tool pprof -alloc_space http://localhost:8080/debug/pprof/heap
四种标签:
pprof 数据分析类型汇总
其他数据的分析和 CPU 的基本一致。下面列举所有的分类:
http://localhost:8080/debug/pprof/ :获取概况信息,即本文第一张图的信息
go tool pprof http://localhost:8080/debug/pprof/allocs : 分析内存分配
go tool pprof http://localhost:8080/debug/pprof/block : 分析堆栈跟踪导致阻塞的同步原语
go tool pprof http://localhost:8080/debug/pprof/cmdline : 分析命令行调用的程序,web 下调用报错
go tool pprof http://localhost:8080/debug/pprof/goroutine : 分析当前 goroutine 的堆栈信息
go tool pprof http://localhost:8080/debug/pprof/heap : 分析当前活动对象内存分配
go tool pprof http://localhost:8080/debug/pprof/mutex : 分析堆栈跟踪竞争状态互斥锁的持有者
go tool pprof http://localhost:8080/debug/pprof/profile : 分析一定持续时间内 CPU 的使用情况
go tool pprof http://localhost:8080/debug/pprof/threadcreate : 分析堆栈跟踪系统新线程的创建
go tool pprof http://localhost:8080/debug/pprof/trace : 分析追踪当前程序的执行状况